What is Resolution? Analyzing Resolution Through Signal Processing and Sampling Theory
Resolution is a term we’re all very familiar with. We say an image has a resolution of 1920x1080, or that a monitor has 4K resolution. We instinctively understand that resolution is important, and often assume that higher resolution is always better—but is this really the case? This article will examine resolution from a technical perspective, exploring what resolution truly is and why it has such a significant impact on display quality. We aim to answer three key questions:
- What is resolution?
- Why is resolution so important?
- Is higher resolution always better?
Using photography as an example, when we capture a photo and say it has a resolution of , we’re actually describing the pixel count of that image. means the photo contains 1920 pixels in width and 1080 pixels in height.
Each of these pixels represents a sampling result of the real world captured by the camera. To better understand resolution, we first need to grasp the concept of sampling.
#What is Sampling?
Sampling refers to selecting discrete points from a continuous signal to represent that signal. This definition inevitably introduces two more concepts: signals and discrete.
When trying to explain a concept as accurately and thoroughly as possible, you’ll unfortunately find that the number of concepts requiring explanation keeps growing.
#What Are Discrete Signals?
A signal refers to a physical quantity that varies over time or space—for example, the sounds you hear, the colors you see, or the sensations you feel when touching objects. These are all signals. In the real world, signals are continuous. Let’s consider an extremely simplified scenario: you’re in a completely black room, looking at a wall where the color gradually transitions from pure black on the left to pure white in the center, then back to pure black on the right.
In your field of vision, you’d see a continuous gradient from black to white and back to black. If we represent your visual field with a function graph, it would look like this, where the X-axis represents your field of view from left to right, and the Y-axis represents color intensity (0 = black, 1 = white):
Clearly, what you see in your field of vision is continuous, so the graph is also continuous. The numerical representation of color here is a continuous signal.
When you take a photo in this room with your phone and view it on a computer, at first glance, you might think the black-to-white transition in the photo is equally smooth and continuous. However, when you zoom in on the photo, you’ll discover individual blocks of solid color—the color changes in discrete “blocks” rather than continuously. These blocks are the pixels of the photo, so the photo isn’t truly “smoothly” continuous but jumps from pixel to pixel in discrete steps.

Similarly, if we represent the color changes in the photo as a function graph, it would look like this, where each dot represents a pixel:
When you look at the photo, you perceive the color changes as continuous because your brain performs a process similar to reconstructing a continuous signal from discrete data—your brain connects the individual dots in the graph above to form a continuous curve.
#Sampling Frequency
In the previous section, we illustrated the difference between continuous signals (your vision) and discrete signals (photographs) through two examples. Sampling is the process of converting continuous signals into discrete signals.
The most critical aspect of sampling is the sampling interval, which can be uniform or non-uniform. Uniform sampling refers to selecting points at fixed intervals from a continuous signal, while non-uniform sampling selects points at irregular intervals.
- When representing images, each pixel in an image is the same size, so images use uniform sampling.
Resolution is the number of sampling points in each direction. Higher resolution means more sampling points in each direction.
When sampling is uniform, the most critical information becomes the sampling frequency—the number of sampling points per unit length. Higher sampling frequency means shorter intervals, more sampling points over the same length, and the discrete signal becomes closer to the continuous signal.
Therefore, the question “why is resolution important?” is equivalent to “why is sampling frequency important?”
From a photo resolution perspective, if you capture images with fixed focal length and field of view, the “unit length” refers to what you can see within the camera’s frame. For a series of photos taken with the same focal length, higher resolution means higher sampling frequency.
Note the emphasis on “focal length” here, because sampling frequency depends not only on the number of samples but also on the sampling range. A photo’s sampling frequency is determined by two factors:
- Focal length: determines your field of view range. Longer focal length means smaller field of view. With the same resolution, longer focal length results in higher sampling frequency.
- Resolution: determines the number of sampling points in each direction. With the same focal length, higher resolution results in higher sampling frequency.
For virtual rendering, the concept similar to focal length is FOV, which affects how much content is rendered:
- With the same resolution, larger FOV results in lower sampling frequency
- With the same FOV, higher resolution results in higher sampling frequency
In the previous example, because the sampling frequency wasn’t too low, we could intuitively reconstruct the continuous signal from the discrete signal. However, if the sampling frequency is too low, we cannot correctly reconstruct the continuous signal.
Similarly, let’s consider an extreme example. In the same pure black room with a black-to-white gradient wall, suppose we capture a photo with resolution. The resulting photo, when plotted as a function, would look like this:
Clearly, when looking at this 1-pixel photo, no matter what, your brain cannot reconstruct it into a continuous black-to-white gradient curve. So here, the 1-pixel image cannot restore the original continuous signal. However, if the room is pure black and the wall is also pure black—meaning everything in your field of vision is pure black—then this 1-pixel photo would accurately represent what you see.
In these two examples (pure black room with a gradient wall vs pure black room with a pure black wall), we captured two photos with the same focal length and both with resolution. But in the first example, we cannot reconstruct the continuous signal, while in the second example, we can.
This example clearly shows that sampling frequency isn’t the only factor—the content of the original signal also affects whether we can accurately reconstruct the continuous signal. This raises the question: “For a given sampling frequency, which original signals can it reconstruct?” The answer to this question is the Sampling Theorem.
#Sampling Theorem
The sampling theorem is a mathematical theorem that describes how to recover a continuous signal from a discrete signal. The core principle of the sampling theorem states: if a continuous signal has a maximum frequency of , and you sample it at a frequency greater than or equal to , then you can perfectly recover the original signal. This is also known as the Nyquist frequency.
From the sampling theorem, we can see that whether sampling results can correctly reconstruct a continuous signal depends on two factors:
- What is the maximum frequency of the original signal
- Whether the sampling frequency is sufficiently high
We already know that for a photo with fixed focal length, the sampling frequency is essentially the resolution. The remaining question is: how can I determine the maximum frequency of real-world signals? For example, in our case of a black-to-white gradient wall, even though I can plot its gradient with a function graph (as shown in the continuous signal function graph above), how do I determine the maximum frequency of this function?
The answer to this question is the Fourier Transform.
#Fourier Transform
The Fourier transform is a mathematical tool that can decompose any continuous signal into a superposition of sine waves. Through the Fourier transform, we can break down any signal into multiple sine waves of different frequencies, and the highest frequency among these sine waves is the maximum frequency of the signal.
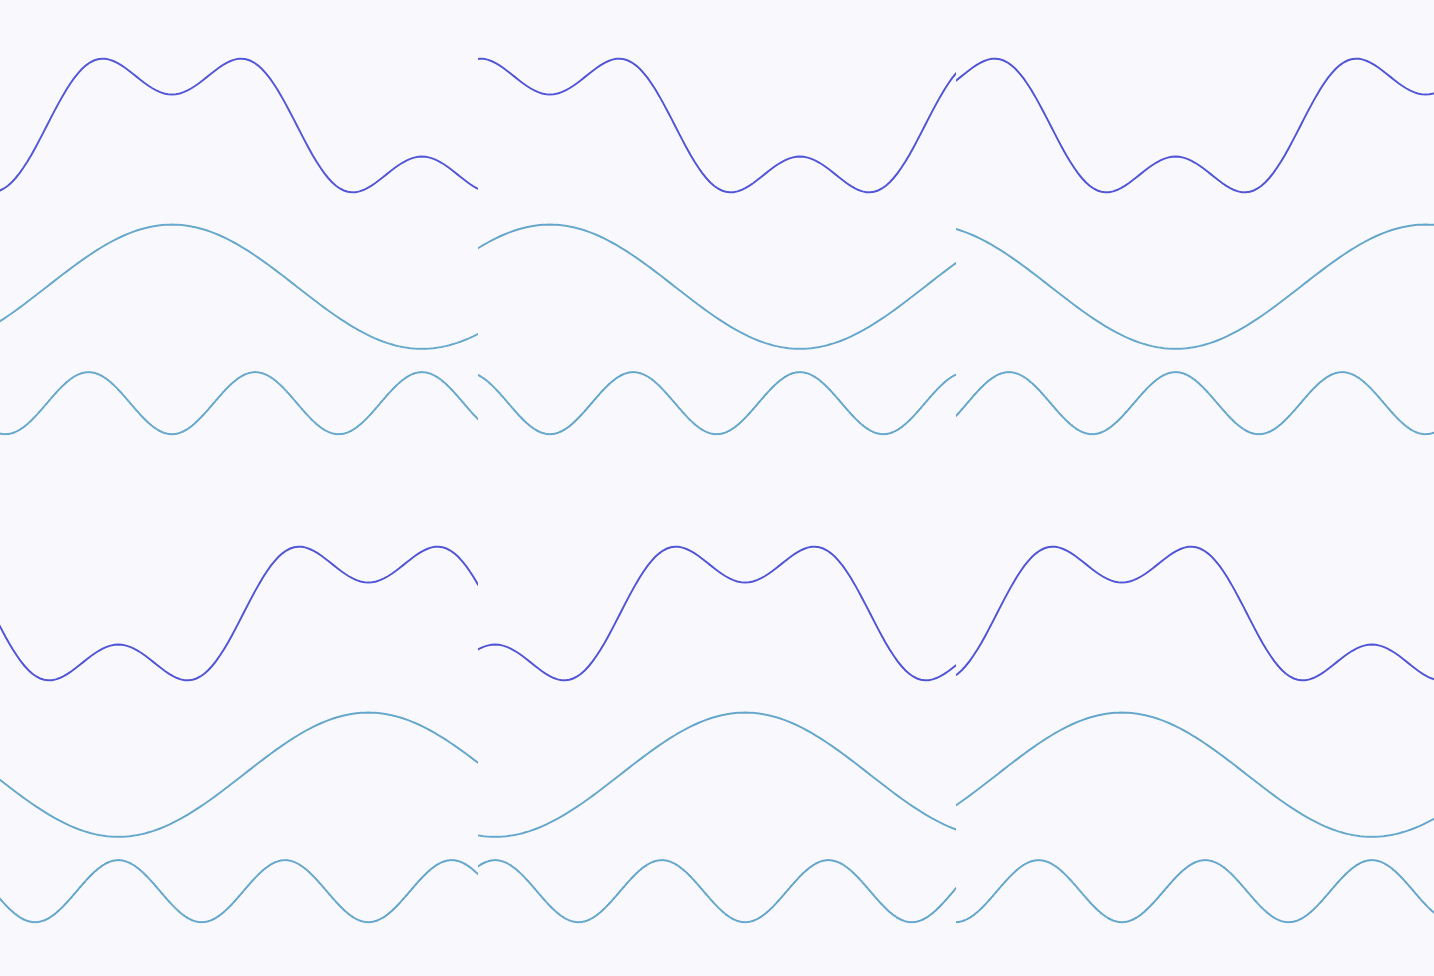
For example, the following continuous signal:

can be decomposed into a superposition of two sine waves with different frequencies. The sine wave at the bottom of the diagram has a higher frequency, and the maximum frequency of this continuous signal is the frequency of the bottom sine wave:

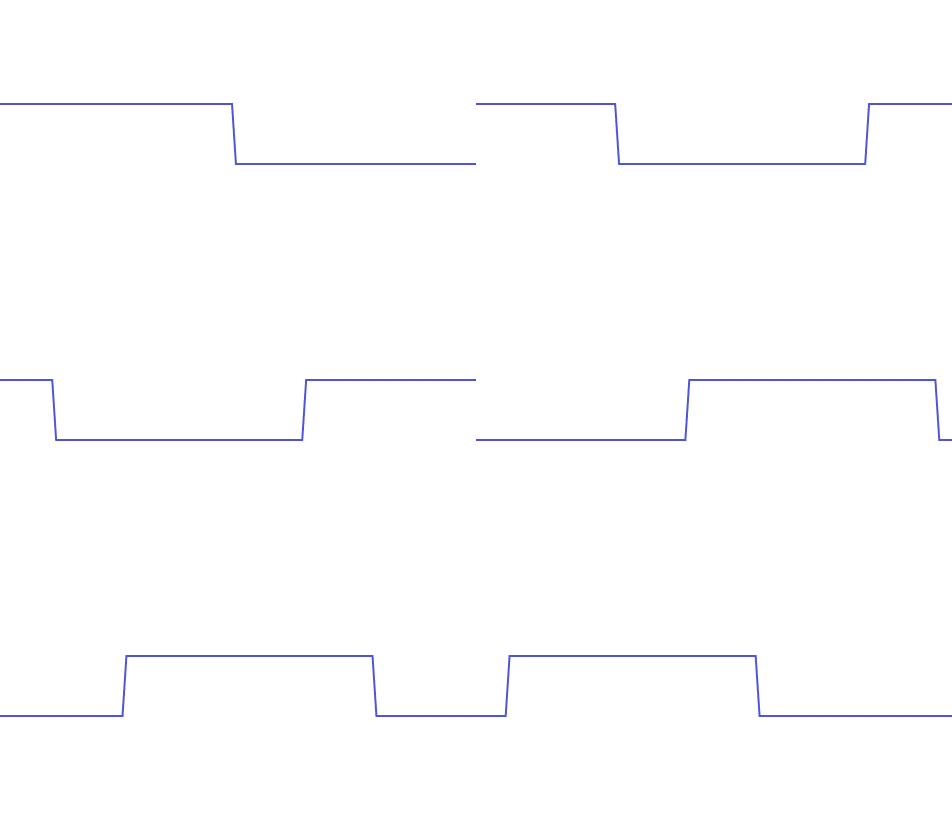
The sharper the changes, the higher the frequency. The sharpest possible change is undoubtedly a vertical line segment. Here is a continuous signal containing an approximately vertical line segment:

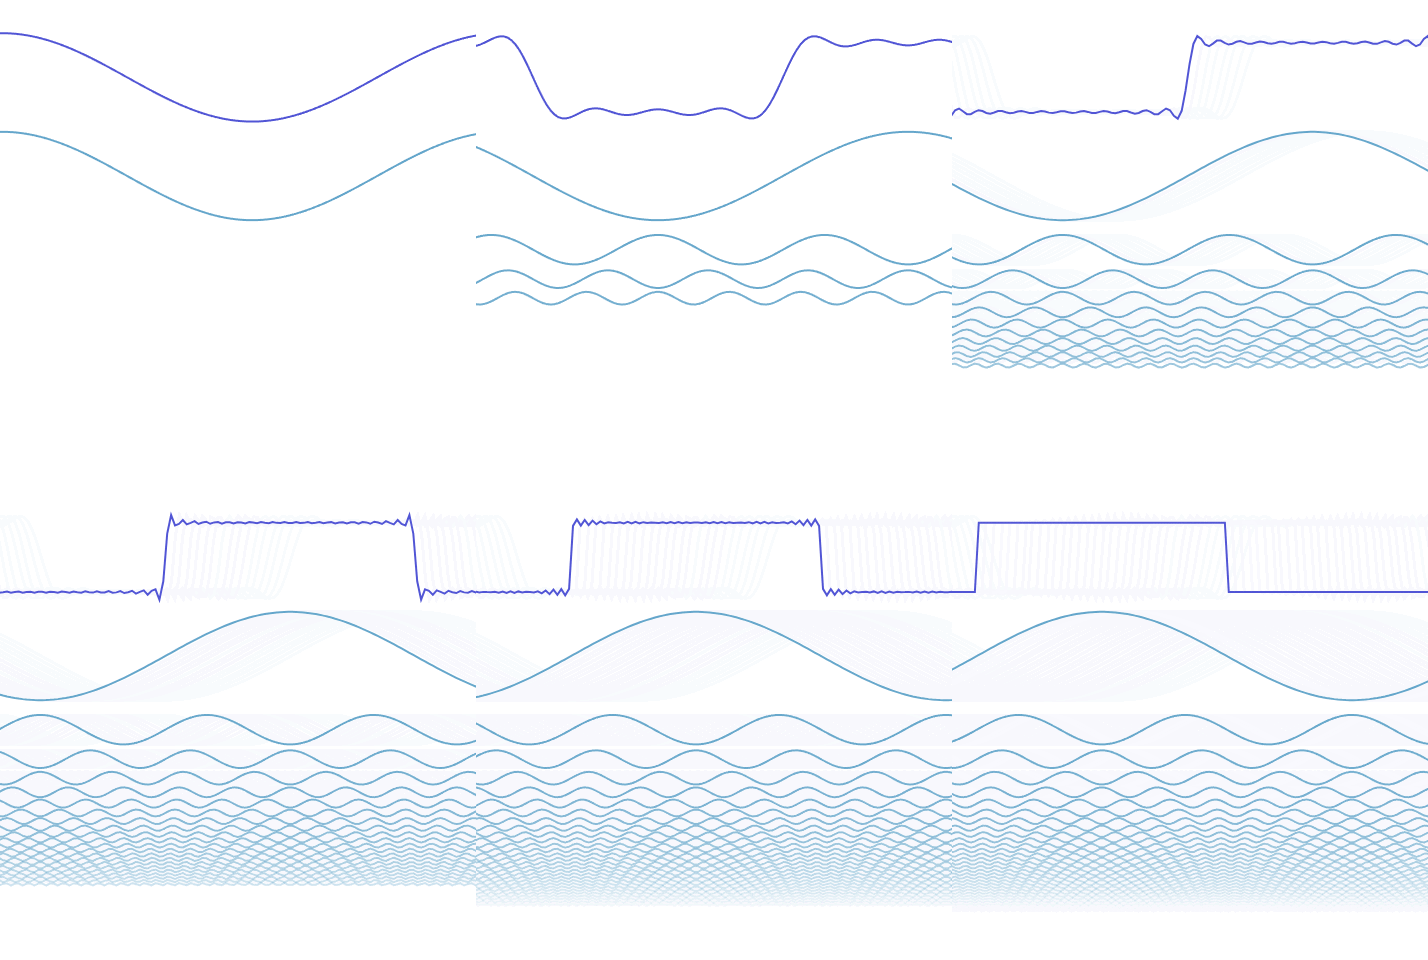
To correctly reconstruct this signal, we need a superposition of sine waves. As the frequencies of the superposed sine waves get higher, we can better reproduce this continuous signal. The maximum frequency of this continuous signal is the frequency of the highest-frequency sine wave when perfectly reconstructed:

From the above examples, it’s clear that for any signal, the faster it changes, the higher the frequency sine waves needed to reconstruct it, which means its maximum frequency is higher and requires a higher sampling frequency to restore the original signal.
In our daily lives, we use the word “detail” to describe rapidly changing parts. For content with more detail, we typically need higher sampling frequencies (i.e., higher resolution under the same focal length/FOV).
Using our wall example again: if the room and wall are pure black, then there’s no change in your field of vision, and clearly there are no details. But when the wall has variations, the faster it changes, the more “detail” you need to perceive.
- Precisely because people find it harder to perceive rapidly changing content, we use the word “detail” to describe it.
#Summary
We now have all the tools needed to analyze resolution from a signal processing perspective. The three questions posed at the beginning of this article have all been answered through our discussion. Let me summarize the answers:
What is resolution?
Resolution is the number of sampling points in each direction of an image. Higher resolution means more sampling points in each direction. When the content to be displayed is fixed, higher resolution means higher sampling frequency for that content, which results in more accurate reconstruction of the content.
Why is resolution so important?
Because higher resolution typically means higher sampling frequency, and higher sampling frequency means we can reconstruct signals with higher frequencies, enabling us to preserve more detail.
Is higher resolution always better?
As explained above, higher resolution enables better restoration of original content, so without considering cost, higher resolution is indeed better.
However, when considering cost, the appropriate resolution level depends on the detail level (frequency) of the content being displayed. Content with higher frequency requires higher resolution for correct reconstruction, while content with lower frequency can use relatively lower resolution.
With fixed resolution, reducing the content frequency (i.e., reducing detail) can also allow us to accurately reconstruct the content.
We can also explain some common phenomena in virtual rendering:
Sharp black-white transitions in images are prone to aliasing/moiré patterns
Black-to-white transitions in images represent vertical changes (from 0 → 1), which as we’ve discussed, contain extremely high frequencies.
This is why images with sharp black-white elements are prone to aliasing/moiré patterns when rendered—the sampling frequency during rendering (determined by resolution and FOV) cannot satisfy the maximum frequency of the original signal (black-white transitions).Aliasing always appears at object edges
Object edges are typically areas of rapid change (when object A and object B are adjacent, the edge of object A represents a sudden transition between A’s color and B’s color), meaning they have high frequency. When the sampling frequency during rendering cannot satisfy this frequency, aliasing occurs.
I hope this article helps you better understand resolution. You should remember several key conclusions, as they are crucial for understanding and optimizing display effects:
- Resolution is strongly correlated with sampling frequency
- Whether the original signal frequency matches the sampling frequency directly determines if the sampled result can reconstruct the original signal
- Sampling frequency is affected by the number of samples (resolution) and sampling range (focal length)
- Original signal frequency is affected by content detail
- More detailed content means higher original signal frequency, requiring higher sampling frequency to reconstruct the original signal
#Reference
An Interactive Introduction to Fourier Transforms: The Fourier transform explanations in this article are primarily based on this resource. On this website, you can also draw arbitrary curves to perform Fourier decomposition.

